In this post, we would like to give you an example of an in silico aortic valve benchtop test, which is traditionally performed in vitro. Furthermore, we will demonstrate how we perform validation on such use-case.
Recently we shared with you what the terms in vivo, in vitro, and in silico mean. As described, in silico methods refer to processes and experiments that take place on the computer. In the context of medical device development, it includes the use of digital twins and simulation for research, development, and assessment of a medical device. Furthermore, in silico methods can be used to prove the conformity of your device to the requirements of regulatory bodies. At this point, you might be wondering: What does such an in silico test look like? And how can you show that a computational model provides accurate and reliable results?
Aortic Valve Replacement
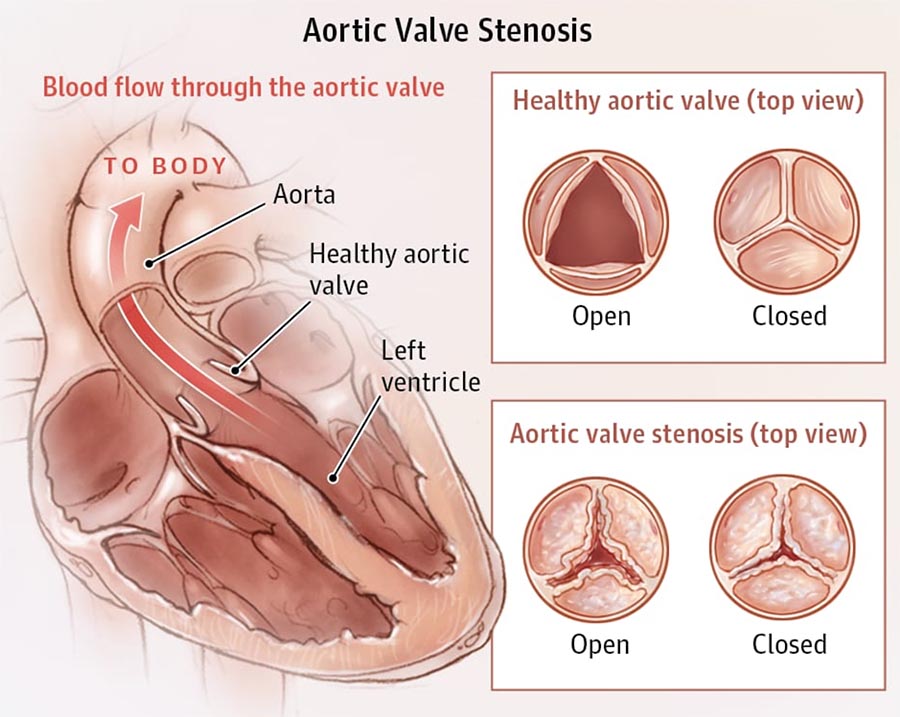
The aortic valve is composed of three cusps or leaflets, which are attached to the wall of ascending aortic root. Aortic stenosis (AS) is the narrowing of the aortic valve, a typical aortic valve disease. The stenosis can be caused by congenital valve defects (e.g., bicuspid aortic valve), rheumatic fever, or valve calcification, and may result in heart failure. In severe cases, replacing the valve either with a mechanical heart valve or a bioprosthetic heart valve is the common treatment. It is key for valve prosthesis developers to assess the safety and risks associated with their device. It must not cause any tissue damage, needs to ensure sufficient blood flow, and at the same time prevent backflow.
Challenges include the risk of stroke, bleeding at the access site, and leakage after implantation. Furthermore, device developers need to consider possible long-term effects, like degeneration of the valve in the patient or blood damage. Therefore, an understanding of the blood flow field and the mechanical response of the valve is essential to the assessment of the potential for degeneration and dysfunction.
Harmonized standards for cardiac valve prostheses
As medical device companies are obligated to show conformity to the requirements of the regulatory bodies, using harmonized norms is the straightforward and recommended practice for this purpose. The ever-growing and updated list of standards consists of requirements and tests for a variety of medical devices. The correspondence of the device to the norm can be shown via in vitro tests as well as simulation.
ISO 5840
The International Organization for Standardization (ISO) working group provides ISO 5840, an approach to validate the design and manufacture of surgical and transcatheter heart prostheses. The standard emphasizes specifying the types of in vitro testing, preclinical in vivo, and clinical evaluations and intends to clarify the required procedures before market release. Regarding computational flow assessment, it requires validation against and correlation to in vitro and in vivo experiments. Additionally, a guideline2 was developed to assess the potential of thrombosis in transcatheter aortic valve replacement, where the numerical simulation is validated by comparison to in vitro experiments.
The norm proposes the following benchtop test for the assessment of the flow field through the heart valve. As Fig. 2 depicts, the heart valve shall be placed in a pulse duplicator system mimicking an idealized aortic root. Pulsatile blood flow with 70 beats/min flows through the valve in the simplified aorta at simulated low and high cardiac outputs (e.g., 2 l/min and 7 l/min). The test solution used should mimic the kinematic viscosity of blood (e.g., 3,5 mm2/s). The flow fields should be analyzed, particularly near the test valve, to investigate any flow disturbances resulting in higher shear stresses, turbulence, and flow stagnation that might occur. In the traditional test done in vitro, this data is retrieved by flow visualization using digital particle image velocimetry (DPIV) or laser Doppler velocimetry (LDV).
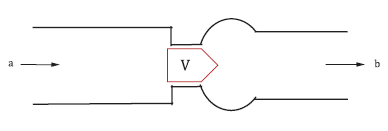
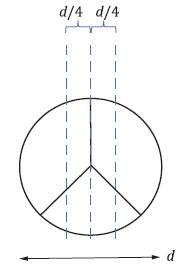
Figure 2: Benchtop Test Setup & symmetric tri-leaflet design according to ISO 5840-1; V: Valve location, a: Inflow direction, b: Outflow direction, d: Diameter of the major axis.3
ISO 5480-1 Benchtop test in silico – Fluid-structure interaction of pulsatile flow with the aortic heart valve
We have seen how the ISO benchtop test would be performed the traditional way. Let us now have a look at how this assessment can be done via computational modeling. The setup was modeled after a reference4, which performed the test experimentally as well as numerically. Thus, our simulation results can be compared to experimental (in vitro) data, as required by the standard.
Setup
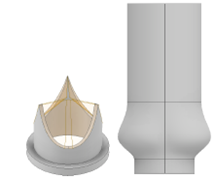
We model the test apparatus according to the given dimensions in the reference4. The respective geometry of the valve and aortic root can be seen in Figure 3.
In order to perform an accurate simulation, it’s not sufficient to merely model the flow alone. The interaction between the fluid and the (vessel) wall also plays an important role in the investigation of the flow field. For this purpose, models considering Fluid-Structure Interaction (FSI) must be used.
The aortic valve benchtop test simulation includes the following features:
| Flow property | Pulsatile Flow |
| Blood Fluid Material Model | Newtonian Fluid |
| Flow Rate Boundary Condition | Period = 1s Peak Flow Rate = 10.74 L/min Peak Reynolds Number = 5571 Womersley Number ≈ 17 Inlet: Parabolic Velocity Profile |
| Valve Leaflets Material Model | Quasi-incompressible Neo-Hookean material |
The simulations are performed using smoothed-particle hydrodynamics (SPH), a meshless method, to solve the governing equations. In SPH, a volume is divided into discrete particles aggregating spatial quantities and interacting together in a bounded neighborhood. While traditional, mesh-based methods like Finite Element Method (FEM) or Finite Volume Method (FVM) require time-consuming mesh generation, our approach allows for automatic particle creation, even for more complex structures like soft tissue.
Results
Let’s have a look at what results the simulation produces. Figure 4 illustrates the result of the simulation. In the initial stage, where no fluid flows, the valve is closed. As the heart begins to contract, blood is ejected toward the aortic valve. This increases the pressure on the aortic valve until it opens and blood flows into the aorta. This ventricular contraction phase until the closure of the aortic valve represents the systole. In the simulation, this is achieved through the pulsatile flow condition and the FSI between the fluid and the aortic valve leaflets. As the flow rate increases, it opens the aortic valve, and the fluid enters the aorta.
Validation of the in silico aortic valve benchtop test
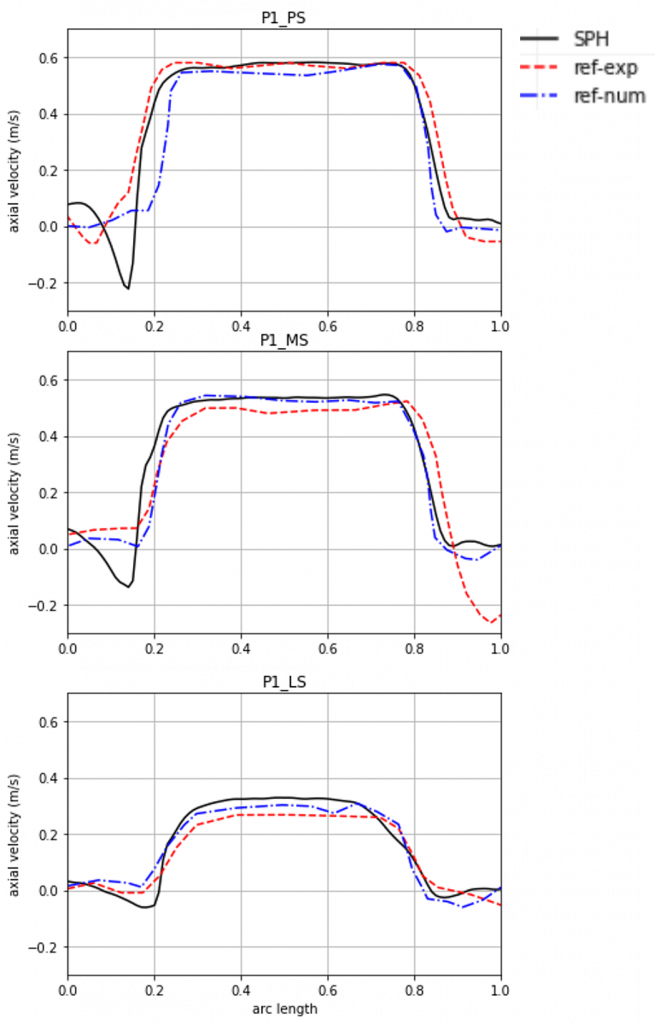
To assess the accuracy of the simulation results, they are compared to experimental results from the literature. The ISO standard prescribes the assessment of the flow field. For this purpose, we want to focus on the velocity profile at different points over the systole, since the simulation corresponds to that phase of the cardiac cycle. The simulation agrees qualitatively as well as quantitatively well with the experimental results as can be seen in Figure 5. Especially, along the open area of the valve the blood flow velocity of the simulation is able to reproduce the experimental results, thereby proving accuracy.
Implant developers for aortic valves can show conformity to ISO 5840 using this simulation.
Summary
This article presents an example of an aortic valve benchtop test performed in silico. In silico tests translate real-world laboratory experiments into a virtual setup and utilize the many benefits that come with a digital environment. The results of such a simulation can be validated by analytical means or reference data from experiments and literature.
Benefits of medical simulations
Beyond the ability to vary parameters, computational modeling excels in its adaptability to (patient) specificity. Additionally, it is able to represent rare diseases and disease states, as well as reduce costs and time. In this case, the costs, time, and effort to deal with the laboratory setup, equipment, and test elements (like the test solution), are removed with the computational approach. Not only does the simulation run in less than one day, but you can also perform multiple simulations in parallel. This means, that a variety of designs can be tested simultaneously which significantly speeds up design optimization.
As the simulation has been shown to correspond to the existing experimental data and literature, it can serve as a valid tool for medical device developers to prove conformity with ISO 5840. Thereby, it fulfills the requirements posed by the regulatory bodies.
We hope this post gave you a thorough example of what an in silico test can look like and how it can be validated. To find out more about in silico methods and medical simulations, don’t hesitate to contact us.
Want us to help you draft a virtual testing plan?
Ask our regulatory experts to establish your virtual testing plan connected to your physical testing. We provide this service for free during a special workshop tailored to you. Learn about the new FDA guidance documents and ASME standards for Computational Modeling and Simulation. Our experts will highlight how you can apply them and streamline your regulatory process.
References
1 https://www.heartvascularcentre.com/structural-heart-and-heart-valve-procedures/what-is-aortic-stenosis
2 Zhenglun (Alan) Wei, Simon Sonntag, Milan Toma, Shelly Singh-Gryzbon, and Wei Sun. “Computational Fluid Dynamics Assessment Associated with Transcatheter Heart Valve Prostheses: A Position Paper of the ISO Working Group”. In: Cardiovascular Engineering and Technology 9 (Apr. 2018).
3 ISO 5840-1:2021, Cardiovascular implants – Cardiac valve prostheses – Part 1: General requirements. International Organization for Standardization, Geneva, Switzerland, 2021.
4 Julien Sigüenza, Desiree Pott, Simon Mendez, Simon J Sonntag, Tim AS Kaufmann, Ulrich Steinseifer, and Franck Nicoud. “Fluid-structure interaction of a pulsatile flow with an aortic valve model: a combined experimental and numerical study”. In: International Journal for Numerical Methods in Biomedical Engineering 34.4 (2018), e2945.